Free annual intercompany comparison
Available on request for all affiliate companies
On request, all companies can be included in a free annual company comparison, which is based on data from annual financial statements.
Each company can use the comparison with industry averages, industry benchmarks, and key figures of specialized companies (e.g. specialized kitchen stores, upholstery specialists) to rank its company in the “overall market” and derive important insights for its own corporate management.
This annual comparison is regularly carried out in November, and is based on the annual financial statements of the previous year available up to that time.
Overview of key figures
On the basis of selected key business figures, our analysis makes it possible to compare your company values with the average values of the participating companies from the furniture trade sector.
In addition, we provide you with an analysis of the figures of 20% of the companies with the best credit standing, so that you can estimate which average values were achieved by the most successful participating companies.
This will show you the range of the real values of these selected key figures and also make it clear that the benchmarks often quoted by consultants are not determined under ivory-tower laboratory conditions, but are “taken from life” and can thus be achieved.
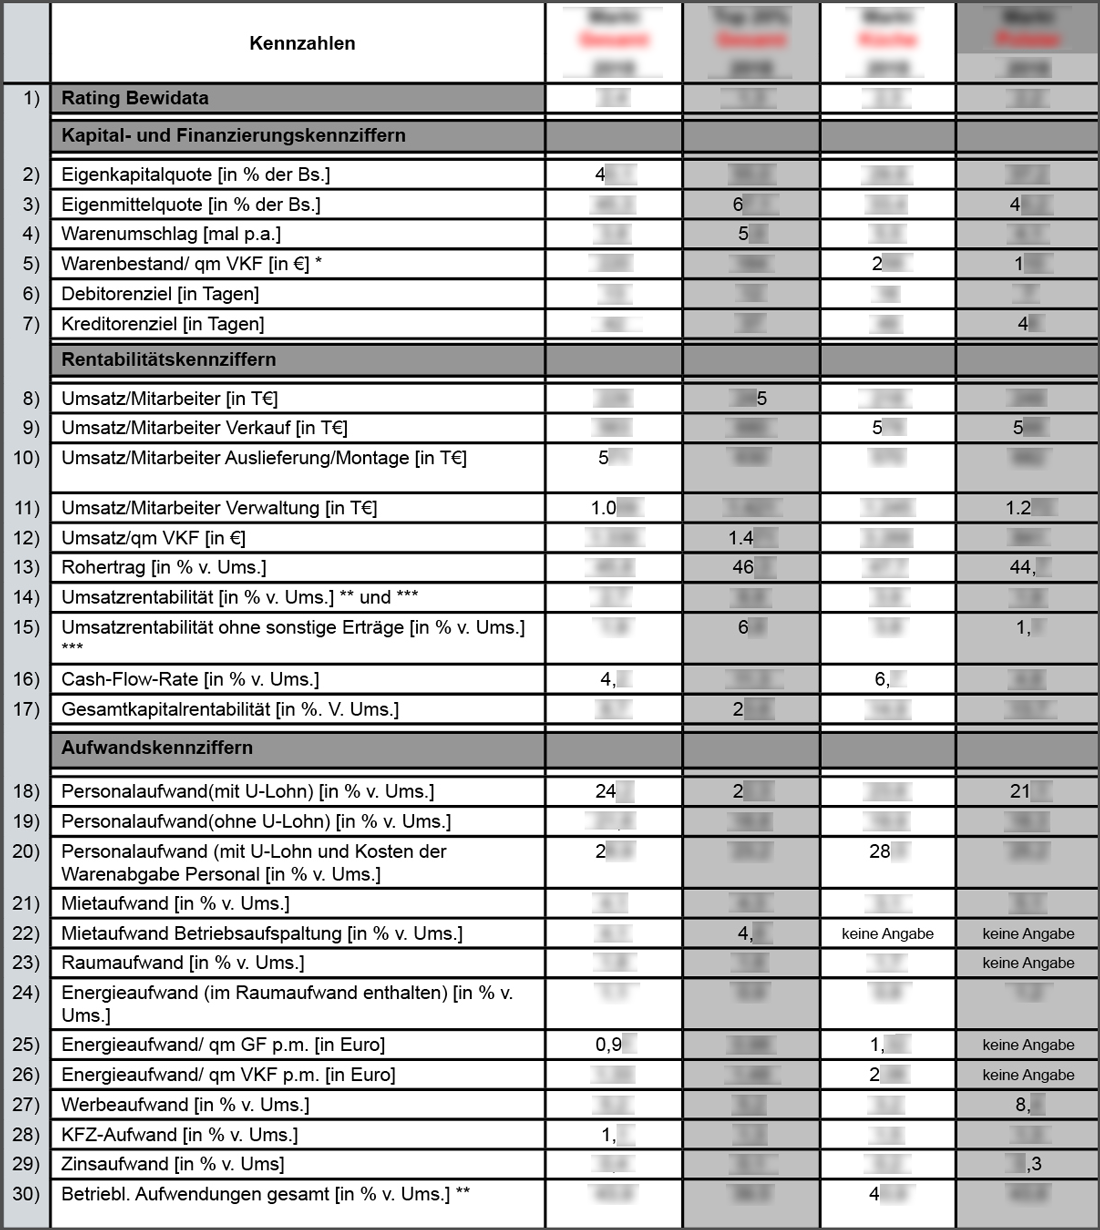
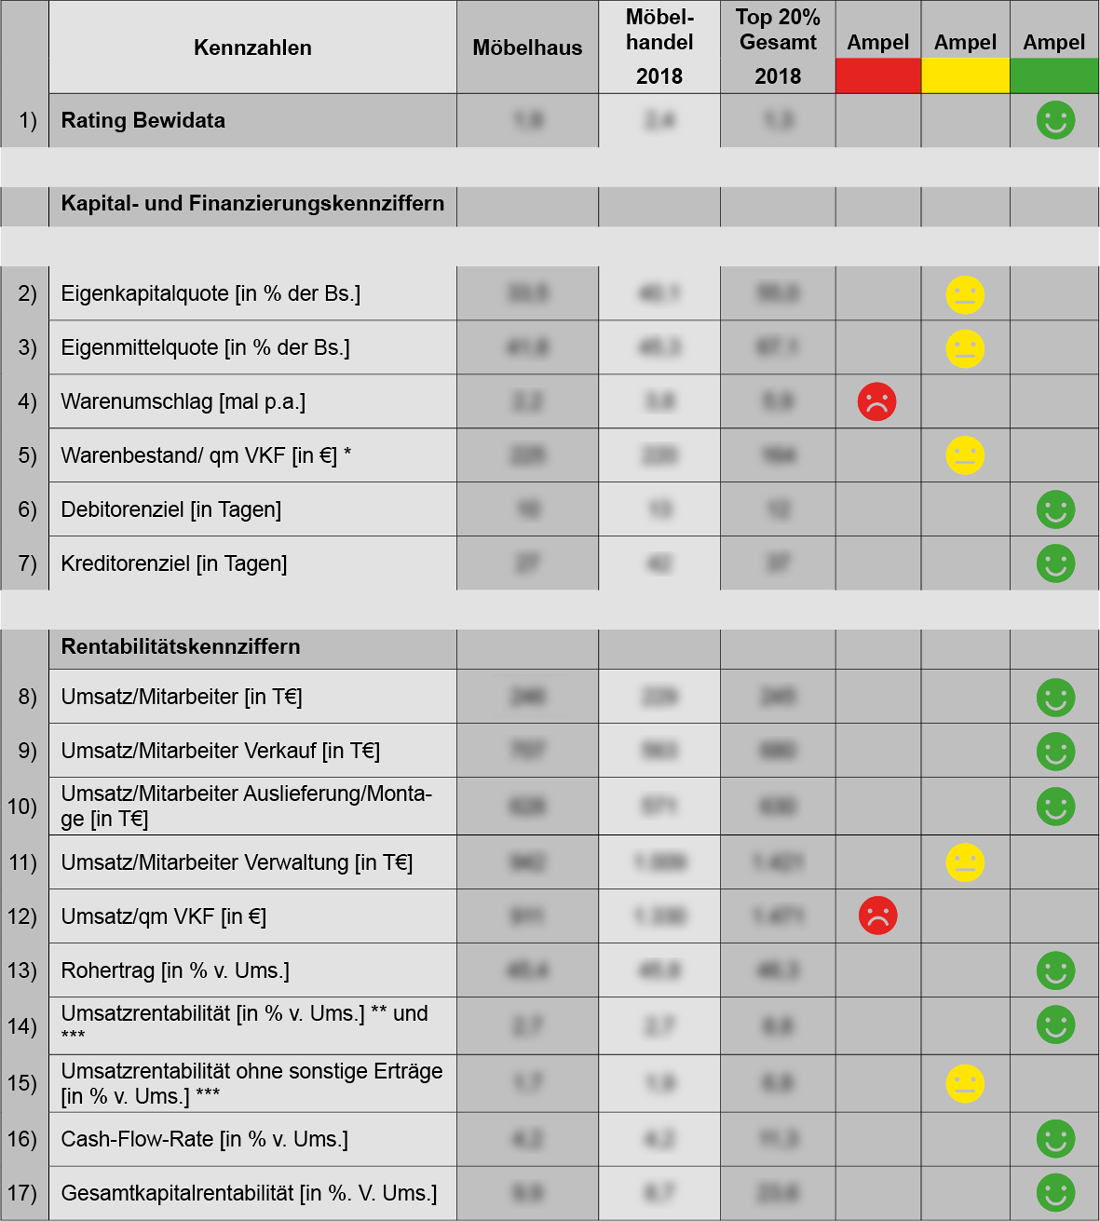
Comparison of company-specific key figures with furniture trade key figures
In a table (see below), selected key figures of your company are listed, which are compared to the two averages mentioned above.
In order not to overburden the presentation, we have chosen the key figures that we consider to be most important.
In the right-hand column, you will find “traffic light symbols” that show you for each key figure whether it indicates a need for action in comparison with the average values (red traffic light) or whether you can already be pleased about comparatively good values for your company (green traffic light).
If your company-specific key figures are within the average range, you will see a yellow traffic light (the “traffic light symbols” do not represent a credit rating of your company).
Further information and optional in-depth analysis
In addition to the presentation in tabular form, the business analysis provides you with information on the relevant key figures, their basic determination, and their significance for the business assessment.
You receive general information on influencing factors and potential for review.
If you are also interested in a more detailed analysis, we look forward to hearing from you!
Feel free to contact us for further information: kontakt(at)bewidata.de.